We’re back with another edition of the Modern Service Management for Office 365 blog series! In this article, we review monitoring with a focus on communications from Microsoft related to incident and change management. These insights and best practices are brought to you by Carroll Moon, Senior Architect for Modern Service Management and Chris Carlson, Senior Consultant for Modern Service Management.
Part 1: Introducing Modern Service Management for Office 365
Part 2: Monitoring and Major Incident Management
Part 3: Audit and Bad-Guy-Detection
Part 4: Leveraging the Office 365 Service Communications API
Part 5: Evolving IT for Cloud Productivity Services
Part 6: IT Agility to Realize Full Cloud Value – Evergreen Management
———-
Thanks to everyone who is following along with this Modern Service Management for Office 365 series! We hope that it is helpful so far. We wanted to round out the Monitoring and Major Incident Management topic with some real, technical goodness in this blog post. The Office 365 Service Communications API is the focus for this post, and the context for this post may be found here. We will focus on version 1 of the API and version 2 is currently in preview.
In order to integrate the information from the Office 365 Service Communications API with your existing monitoring toolset, there are two main options:
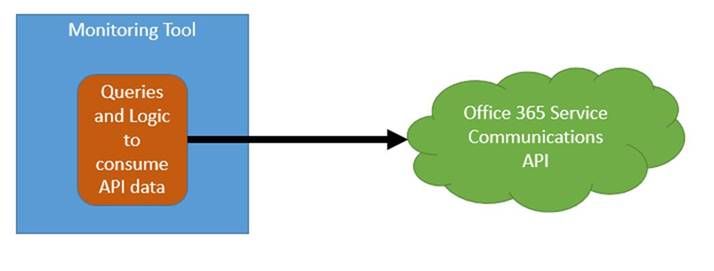
- Integrate the queries and logic directly into your toolset. This is how the Office 365 SCOM Management Pack is designed.
Often though, in large enterprises, the monitoring team may be in a separate organization from the Office 365-focused team. Often their priorities and timelines for such an effort in a 3rd party tool do not align. Also, it is often the case that the monitoring tools team’s skillset is phenomenal when it comes to the tool, but less experience exists in writing scripts with a focus on Office 365 scenarios. All of that can be worked through, but it is often simpler to have the Office 365 focused team(s) focus on the script and the business rules while the monitoring team focuses on the tool. In that case, the following scenario tends to work better:
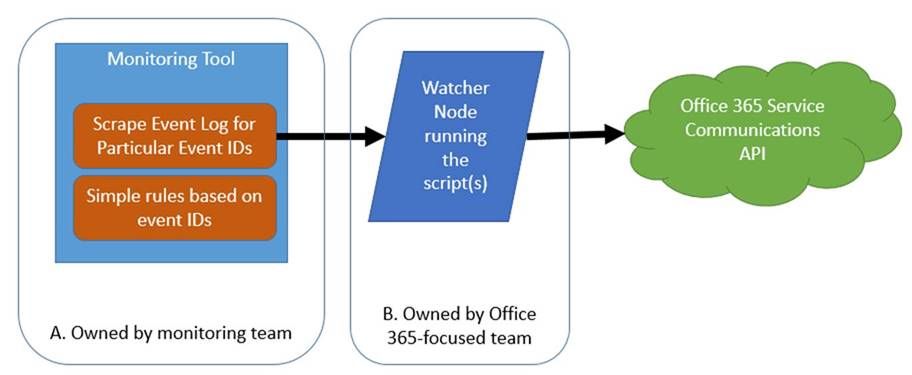
- Decouple the queries and logic from the toolset. The script runs from a “watcher node” (which is just a fancy term for a machine that runs the script) owned by the Office 365-focused team, and then the monitoring team simply a) installs an agent on the watcher node b) scrapes the event IDs defined by the Office 365-team and c) builds a few wizard-driven rules within the monitoring tool. This approach also has the benefit of giving the Office 365-focused team some agility because script updates will not require monitoring tool changes unless the event IDs are changing. This approach is also helpful in environments where policy does not allow any administrative access to Office 365 by monitoring-owned service accounts.
Microsoft does not have a preference as to which approach you take. We do want you to consume the communications as defined in the “monitoring scenarios” in this blog post, but how you accomplish that is up to you. For this blog post, however, we will focus on option #2.
The guidance and suggestions outlined below are shared by Chris Carlson. Chris is a consultant and helps organizations simplify their IT Service Management process integration with the Microsoft Cloud after spending time in the Office 365 product group. Chris has created sample code as an example (“B” above). Chris has also defined the rules and event structure that your monitoring team would use to complete their portion of the work (“A” above). The rest of this article is brought to you by Chris Carlson (thank you Chris!!)
Carroll Moon
———-
As Carroll has alluded, my recommended method for monitoring Office 365 is to leverage the Office 365 SCOM Management Pack. But for those Office 365 customer’s that do not already have an investment in System Center and no plans in the near future to deploy it, I don’t believe that should reduce the experience when it comes to monitoring our online services and integrating that monitoring experience into your existing tools and IT workflows. In order to realize Carroll’s decoupled design in section #2 above we will need some sort of client script or code that will call the API and then output the returned data into a format that we can easily ‘scrape’ into our monitoring tool. For the sake of this example, I will focus on how this can be accomplished using some sample code I published a few days ago. This sample code creates a Windows service that queries the Office 365 Service Communications API and writes the returned data into a Windows event log that can easily be integrated into most 3rd party monitoring tools available today. I’ll walk through the very brief installation process for the sample watcher service, run down the post installation configuration items needed to get you setup and then provide details on what events to look for to build monitoring rules. So let’s get started.
Installation
First off we need to download the sample watcher code and identify a host where we want this service to run. For the purpose of today’s write-up I am installing this onto my Windows 10 laptop but there should be no restriction as to where you run this. Of course the usual caveats apply that this is sample code and you should test in a non-production environment…with that disclaimer out of the way, if you are not one to mess with Visual Studio, for whatever reason, and don’t want to compile your own version of the watcher I did include a pre-compiled version of the service installer in the zip file you will find available for download. To locate this installer, simply download the sample solution, extract the zip file to a location on your local drive and navigate to the <Extracted Location>C#Service Installer folder and there you will find setup.exe.
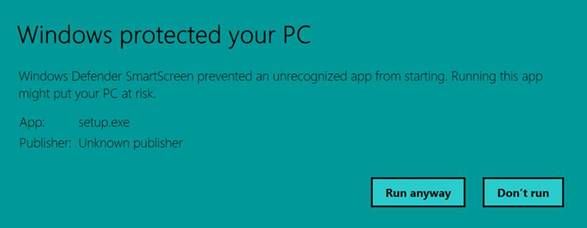
When running setup.exe may run into Windows Defender trying to protect you with the following warning message:
If this does appear, simply click the More info button I circled above and you’ll be presented with a Run anyway button which will allow you to bypass the defender protection, as shown below.
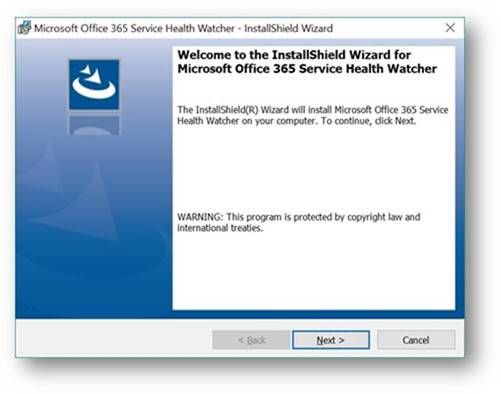
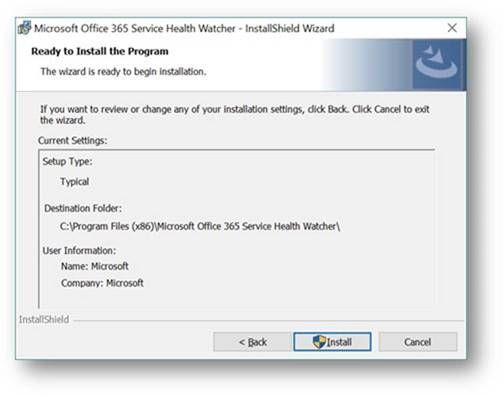
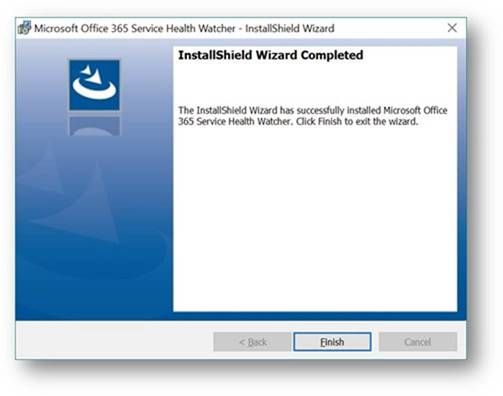
Once we are passed the Windows Defender warnings, the installation really is straightforward. There are three wizard driven screens that will walk you through the service installation process and as you will see in this sample there is no configuration required during the wizard, simply click Next, Install and Finish, as shown below.
Once the installation wizard has completed, you can verify installation by looking at the list of installed applications via the usual places (Control Panel, Programs, Programs and Features). My Windows 10 machine shows the following entry.
In addition, you can open the services MMC panel (Start->Run->Services.msc) and view the installed service named Microsoft Office 365 Service Health Watcher. The service is installed with a startup type of automatic but left in a stopped state initially. This is because we have some post installation configuration to do prior to spinning it up for the first time. (Yes, I could have extended the install wizard to collect these items, but we’re all busy and this is sample code.) Please read on because the next section will discuss the required configuration items that need to be set and all the other possible values that are available in this sample to modify the monitoring experience.
Service Configuration
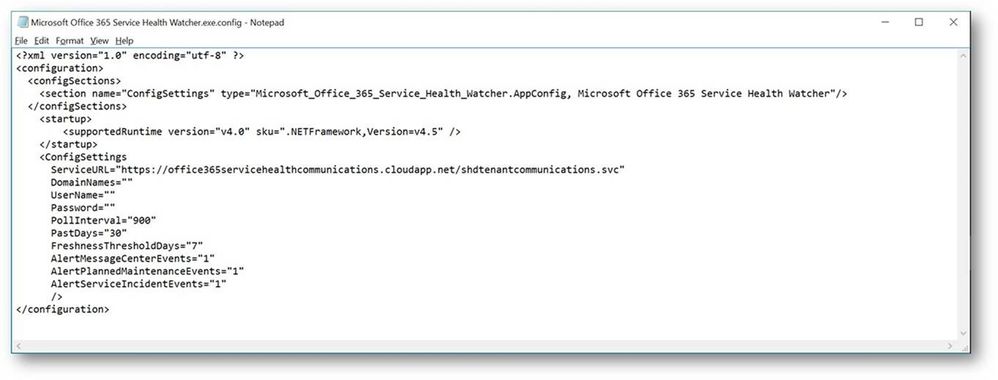
So now we have an installed Windows service that will poll the Office 365 Service Communications API for data but we need to tell that service which Office 365 tenant we are interested in monitoring. To do this we need to open the configuration file and enter a few tenant specific values. The service we installed above places files into the C:Program Files (x86)Microsoft Office 365 Service Health Watcher folder and it’s in that location that you will find the file named Microsoft Office 365 Service Health Watcher.exe.config. This is an XML file so you can open and modify it in any of your favorite XML editors, I am using trusty old Notepad for my editing today. When you open the file you will see a few elements listed, similar to the ones below, what we care about however are the attributes of the ConfigSettings element.
There are several attributes here that can change the way this sample operates, I have listed out all attributes and their meanings below in Table 1, but to get started you need only update the values for DomainNames, UserName and Password. Referring back to the sample code download page, DomainNames represents the domain name of the tenant to be monitored, i.e. contoso.com, adventureworks.com, <pick your favorite MSFT fake company name>.com. UserName needs to contain a user within that same tenant that has been granted the Service administrator role, for more information on Office 365 user roles please review the Office 365 Admin help page. Password is the final attribute that requires a value and this will be the password for the user you defined in the UserName attribute. As noted on the sample code page, this value is stored in plain text within this configuration file. This sample can certainly be extended with your favorite method of encrypting this value but for the sake of board sample usage I chose not to include that functionality at this time. I do however recommend the account used is one that only has the Service administrator role and you review who has permissions to this file to at least ensure a basic level of protection on these credentials.
Table 1 – Watcher Service Configuration items
|
Configuration Item |
Description |
|
ServiceURL |
This is the URL endpoint for the Service Comms API |
|
DomainNames |
The domain name of the tenant to be queried for i.e. contoso.com |
|
UserName |
The name of a user, defined in the Office 365 tenant, that has ‘Service Administrator’ rights. |
|
Password |
The password associated with the above user. See notes about securing this value |
|
PollInterval |
This value determines how often, in seconds, the API is polled for new information. The default value is 900 seconds, or 15 minutes. |
|
PastDays |
How many days of historical data is retrieved from the API during each poll. The default value is 30 days and it is recommended not to modify this value. |
|
FreshnessThresholdDays |
The number of days the locally tracked data in the registry is considered ‘fresh’. This value only applies in case where the API has not been polled for an extended period of time. The sample code will ignore the data in the local registry and update it with new entries from the next API call. |
|
AlertMessageCenterEvents |
Can we used to turn off events related to general notifications found in the Message Center. A value of 0 will disable these events and a value of 1 will enable them, the default value is 1. |
|
AlertPlannedMaintenanceEvents |
Can we used to turn off events related to Planned Maintenance. A value of 0 will disable these events and a value of 1 will enable them, the default value is 1. |
|
AlertServiceIncidentEvents |
Can we used to turn off events related to Service Incident messages. A value of 0 will disable these events and a value of 1 will enable them, the default value is 1. |
Once you have defined values for these three required items it’s time to fire up the service and give it a try! Read on for what to expect from this sample watcher and how you can, should you choose, build monitoring rules to integrate into your existing systems.
Using the watcher sample to monitor Office 365
To briefly recap, in the previous sections we have installed a sample watcher service and configured it with our Office 365 tenant specific information so now we are ready to let it connect to the Office 365 Service Communications API for the first time and start monitoring our Office 365 tenant, great! If we go to the services MMC panel (Start->Run->services.msc) we can start the service named Microsoft Office 365 Service Health Watcher, as shown below.
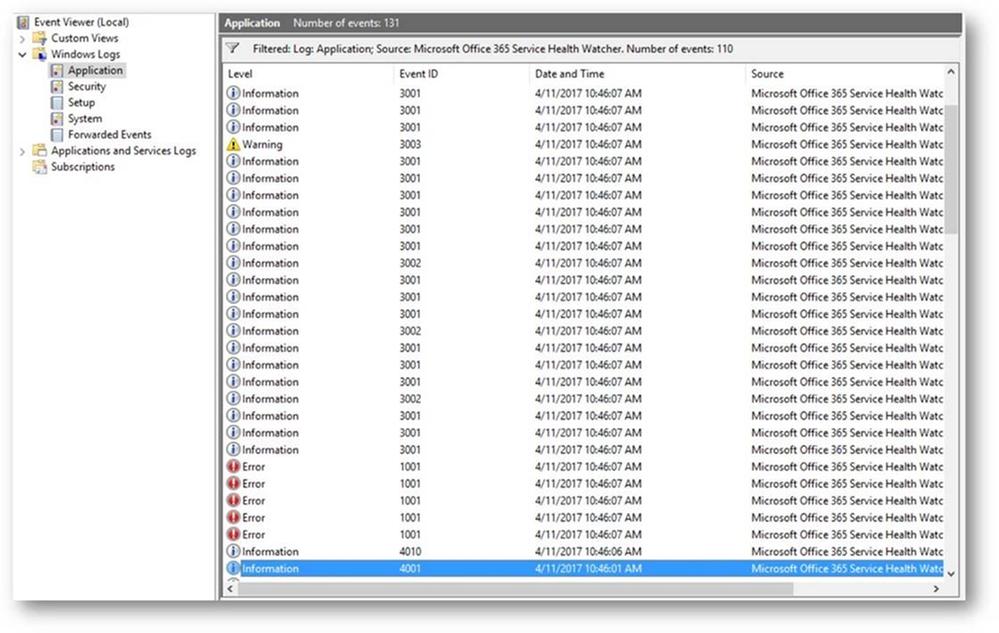
This service will write it’s events to the Application event log on the Windows host it was installed on. So let’s open Event Viewer (Start->Run->eventvwr.msc) and see what data we are getting back. Below is a screen shot of my Application event log filtered to an event source of Microsoft Office 365 Service Health Watcher, that is the source for all the events this sample writes to the Application event log. NOTE: You are certainly welcome to extend the sample and register your own source and event values if you like, sky is the limit on that kind of stuff.
We see above that there is a lot of data coming back from the Service Communications API, so let’s dig into some of these events and see what data this thing is returning…
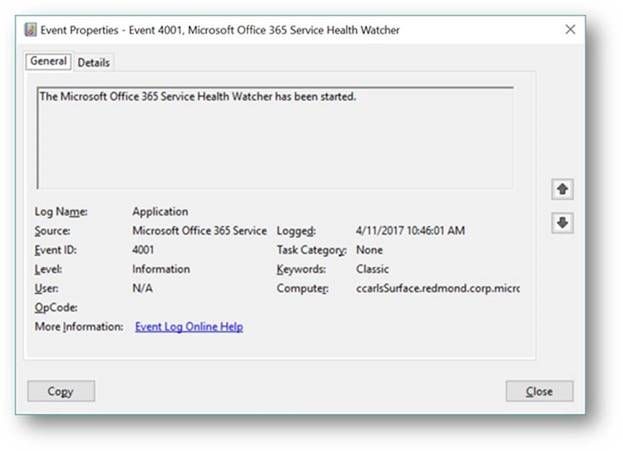
First we are greeted with a few standard messages, those events with IDs in the 4000 range are related to the watcher process itself, for instance the first two are basic messages that the service has in fact started and it’s starting a polling cycle:

Not terribly interesting but they can be leveraged as a type of heartbeat to ensure monitoring of Office 365 is occurring. For instance, in most monitoring tools you can build a rule that contains logic that will alert when an event is NOT detected within a known period of time, in this case we should be dropping these events every 15 minutes assuming the default polling interval. If we don’t see event ID 4010 then we know we our monitoring is not working for some reason and need to investigate as we could miss important data related to Office 365 service incidents.
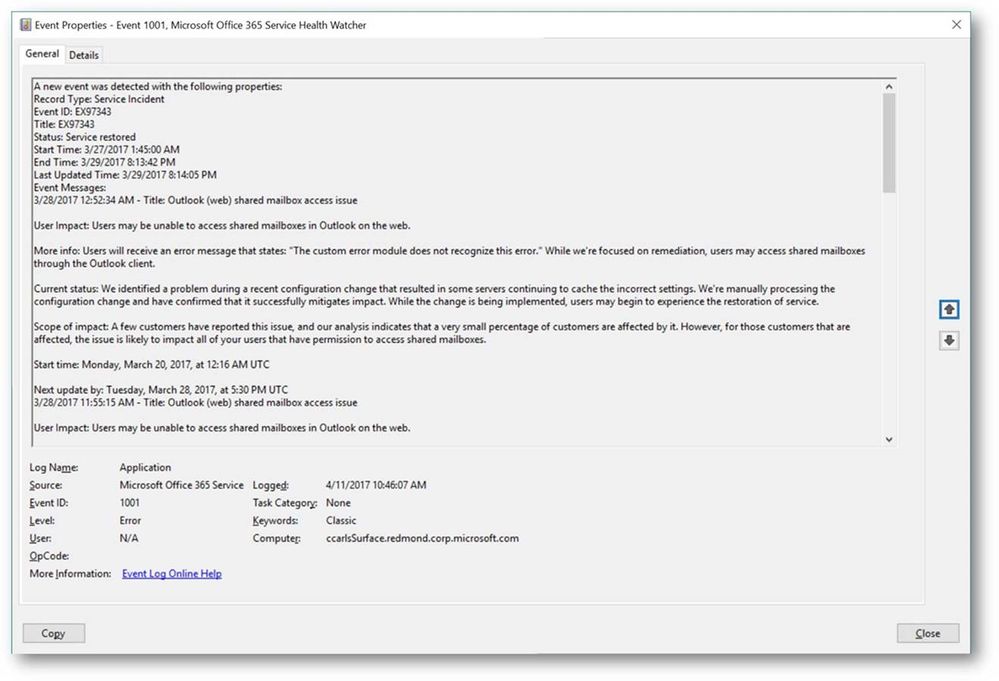
Moving on to examine a few more of the events, we see that the next one that was written was an error event with an ID of 1001, for this sample watcher event IDs in the 1000 range denote events related Service Incidents. We can see in the event below that this was an Exchange Online related issue with OWA access that occurred sometime back and has since been resolved.
Service Incidents will progress through a series of state, or ‘status’, changes throughout the lifecycle of that incident so you can use the status field returned in these events to further key alerting to specific workflow states i.e. Service restored, Post-incident report published, etc.
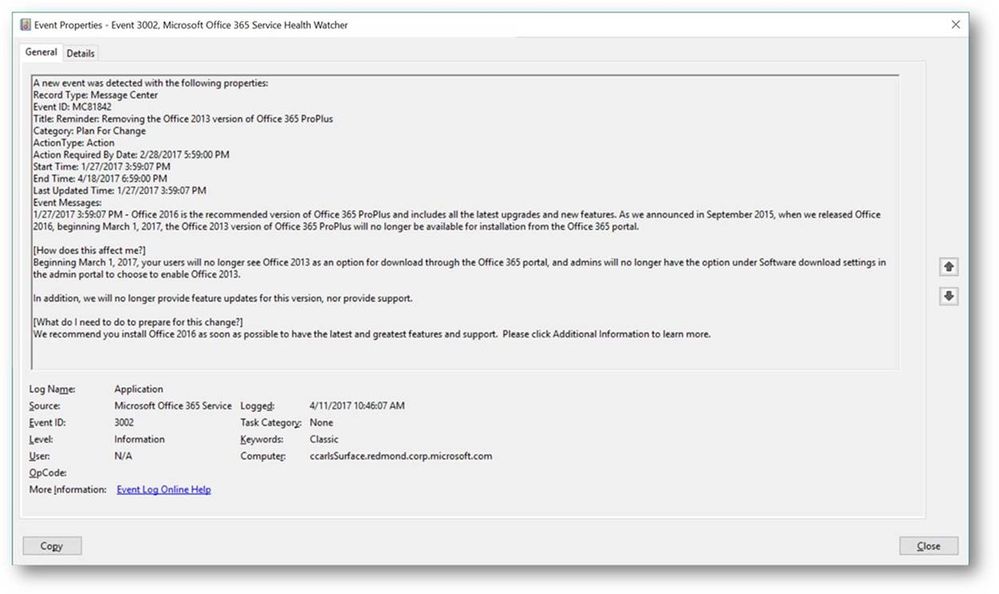
In addition to Service Incident events this watcher sample also drops events related to Planned Maintenance and Message Center event types. The Message Center is the primary change management tool for Office 365 and is used to communicate directly to admins and IT Pros. New feature releases, upcoming changes, and situations requiring action are communicated through the Office 365 Message Center and this API. The example below is a communication that Office 2016 is now recommended and that Office 2013 version of ProPlus will not be available from the portal starting March 1st.
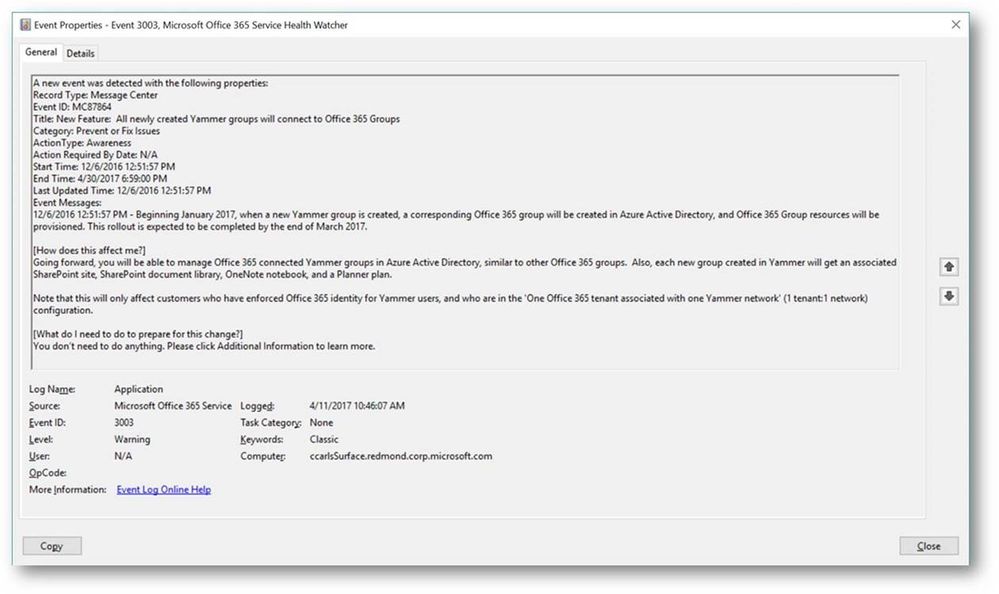
Another example, below, is a communication related to Yammer and how your tenant may be affected.
In many cases these messages, not just service incidents, represent direct action that needs to be taken by someone, whether that individual is within IT or another business unit depends but awareness of the messages needs to be communicated, or ‘alerted’, to the appropriate person or automated workflow. To that end the table below represents a full list of the event types and the event ID that can be dropped by this sample watcher service. In addition I have provided a description of what my intention was when writing the event to the event log and how it might be used to build monitoring related rules.
Table 2 – EventIDs and Descriptions
|
Event Type |
EventID |
Purpose |
|
Service Incident |
1001 |
This event indicates a new service incident has been posted for the monitored Office 365 tenant. This should be used to alert that a new service incident has been detected. NOTE: This will event will also be written when the service is started for the first time and an existing service incident is returned from the API. This will also be written when the watcher has been offline longer than the value listed in FreshnessThresholdDays in the XML config file. |
|
Service Incident |
1002 |
This event indicates a status change for a tracked service incident, since the last poll cycle. This should be used to notify that something noteworthy has changed with the service health state. A review of the service incident’s status message should take place to determine what the status change is. For example, if a service incident has changed from an active state to a resolved status. |
|
Service Incident |
1003 |
This event is used simply to inform that we are still seeing data being returned for a tracked service incident, it really is informational in nature. |
|
Planned Maintenance |
2001 |
This event is written when a new Planned Maintenance message has been posted for the tenant. The same conditions as noted for event 1001 apply as to the conditions under which this event would be written. |
|
Planned Maintenance |
2002 |
Like event 1002, this event informs that status has changed, since the last poll cycle, for this planned maintenance event. This event should indicate that a planned maintenance has started, cancelled or been completed. |
|
Planned Maintenance |
2003 |
Like event 1003, this event just notes that we are still seeing data for a tracked planned maintenance event and is informational only. |
|
Message Center |
3001 |
Indicates a new Message Center event with a category of ‘Stay Informed’ was returned by the API. |
|
Message Center |
3002 |
Indicates a new Message Center event with a category of ‘Plan for Change’ was returned by the API. |
|
Message Center |
3003 |
Indicates a new Message Center event with a category of ‘Prevent Or Fix Issues’ was returned by the API. |
|
Health Watcher |
4001 |
Indicates that the watcher service has been started |
|
Health Watcher |
4002 |
Indicates that the watcher service has been stopped |
|
Health Watcher |
4003 |
A connection attempt to the Service Communications API was attempted but was unsuccessful, possibly due to network connectivity or invalid credentials. |
|
Health Watcher |
4004 |
A successful connection to the Service Communications API was made but no event data was returned. A likely reason for this would be attempting to use a credential without enough permissions to retrieve data for the specified tenant. |
|
Health Watcher |
4006 |
Indicates that an unhandled exception was detected in watcher code. |
|
Health Watcher |
4008 |
This event is dropped when a tracking registry key is deleted. This would only occur if there is tracked data in the registry and the watcher enters a ‘first poll’ experience. This would most likely be when the watcher has been offline longer than the value of FreshnessThresholdDays. |
|
Health Watcher |
4009 |
This event is written when the XML configuration file does not contain a value for DomainName, UserName or Password. Typically this would be if the service is started before the XML config file has been updated. |
|
Health Watcher |
4010 |
An event that is written each time the API polling cycle begins i.e. every 15 min by default. This can be used to determine if API polling is still functioning i.e. monitor for the absence of this event within the last N # of minutes. |
|
Health Watcher |
4011 |
An event that is written each time the API polling cycle completes |
More information
I am always looking for feedback and am happy to answer any questions. If you have any feedback, comments, questions, concerns or even suggestions on how to improve the sample watcher service feel free to leave comments on this blog post or use the Q & A section on the sample code download site. As Carroll mentioned, we’ll be looking to update this sample in the near future using the V2 API and incorporate the changes coming with that version.
<Please note: Sample code is shared for reference and not officially supported by Microsoft Support teams. All recommendations and best practices are the opinions are those of the authors. We recommend that you test and validate any code or scripts prior to deploying into production environments.>

