A growing rise in regulatory requirements places more onus on organizations to control the geographic location of where data is stored so that it can be kept within specific regional boundaries.
If you don’t have a solution for this, you may feel less confident in expanding your business into new markets, distributing your workforce or even moving to the Cloud. The traditional way to tackle data residency has been to manage people and resources who reside in different countries or regions within the organization as separate entities, even though you are all part of the same organization.
To solve for this, maybe you’ve opted for a distributed datacenter model on-premises aligned to geographic locations, or perhaps you find yourself maintaining a often complex hybrid architecture to offer Office 365 to users in a limited number of geographies to address data compliance needs.
While this can potentially keep your data in the appropriate location, we know that these approaches can be expensive and worse of all, create data silos, which limit collaboration on your organizations most important currency, information. Data fluidity, or lack of it, constrains your organization’s overall productivity and innovation.
The good news is that there’s now a better and more efficient way to solve for this challenge with Multi-Geo in Office 365. It allows you to operate a single global Office 365 tenant and facilitates control to pin point locations around the world where each user’s content is stored at rest and where future content will be stored.
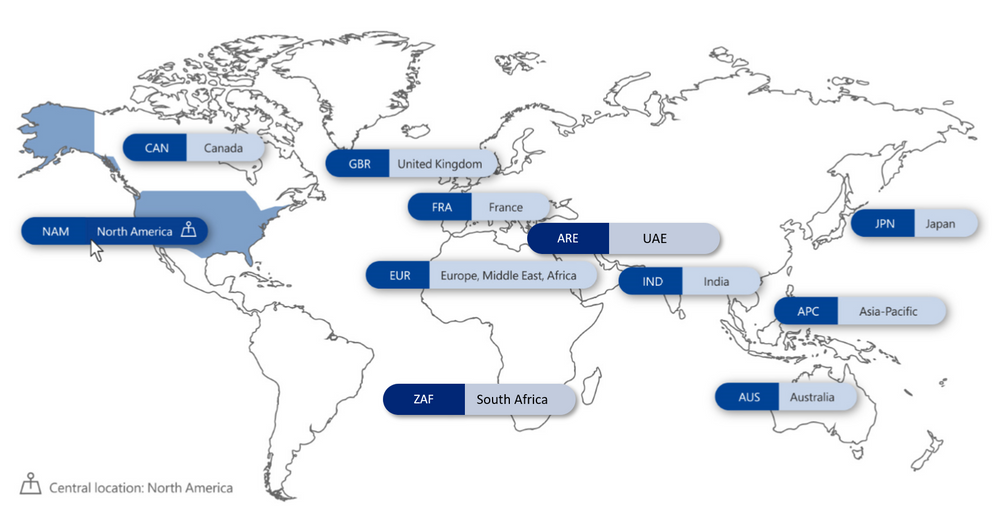
Office 365 Multi-Geo capabilities enable a single Office 365 tenant to span across multiple Office 365 datacenter geographies (geos), and gives customers the ability to store their Exchange Online and OneDrive, SharePoint Online and Office 365 Groups data, at-rest, on a per-user basis, in their chosen geos and today we’re pleased to announce to expanded Office 365 Multi-Geo capabilities to South Africa and the United Arab Emirates.
Learn more on how Office Multi-Geo works, how to get started, and FaQ’s in the Microsoft Mechanics video below:
Learn more about Office 365 Multi-Geo pricing and how to get started at https://products.office.com/en-us/business/multi-geo-capabilities.
Additional Resources
Office 365 Multi-Geo Resource Center
Office 365 Multi-Geo Community on the Microsoft Tech Community
Office 365 Multi-Geo Capabilities eBook
Addressing data residency needs with Microsoft 365 eBook
Building informative and attractive pages is an essential step in engaging employees with news, applications, and critical information in SharePoint and Microsoft Teams. Today we’re pleased to announce a series of enhancements to make authoring pages faster and more intuitive.
All of these are scheduled to start rolling out to Targeted Release in August 2019, with general availability following soon after.
Undo/Redo
Office applications such as Word have long offered “undo” actions after a change. Now, we’re bringing this option to SharePoint pages as well, providing the option to undo changes during authoring. Once you save or publish your page, you can no longer undo previous changes.
Drag and drop files to the canvas
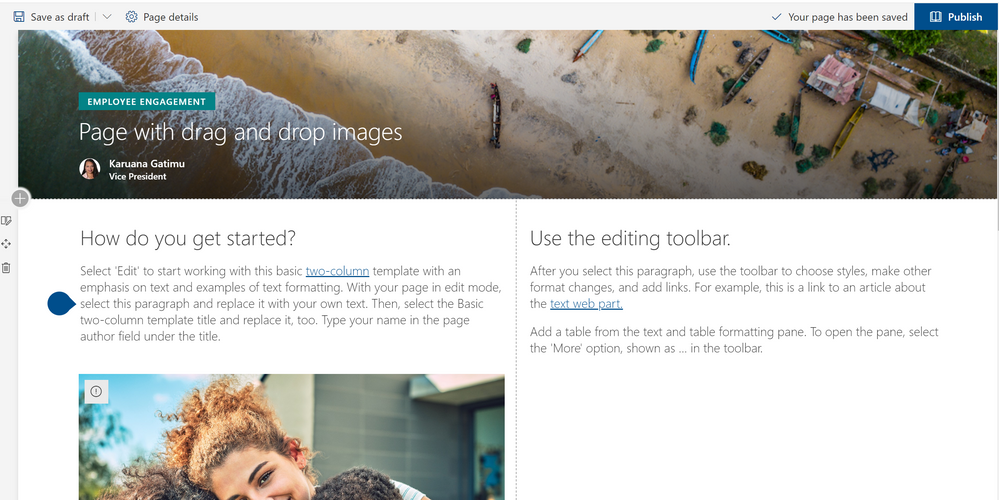
Adding files to pages is simpler than ever. You can drag and drop files from desktop views and SharePoint will automatically add the file viewer and upload the file to the SharePoint document library. We’ve also added a rich preview for links pasted into the text editor to embed videos from Stream and YouTube links, or images with title and description from other links.
Click here or on the image below to see how easy it is to drag and drop files into your pages.
New vertical sections
As mentioned on our home site announcement blog, modern pages can now have vertical sections as shown below.

Recommendations
Pages and news can now include a web part showing related and recommended content. Pages are suggested based on trends and personalization derived from the Microsoft Graph.

On page anchors
Beautiful long-form content brings expansive information to your pages. Now you can add links to headings within that content to focus readers on the most relevant portions of your content.
SharePoint automatically adds anchor links to all first, second and third level headings in your page. Then simply hover over the headings and you’ll see a link symbol. Clicking it will give you the fully rendered URL, including the anchor. If you click this symbol, the heading will be added to the URL bar, or you can right-click to save it to your copy buffer.

Please continue to stay engaged with us on the TechCommunity and on UserVoice as we continue to update our page and news authoring experiences. Thanks.

If you need to streamline business processes, you need great tools to edit data in lists and libraries. Excel has long been a foundational tool for collecting, editing and analyzing data. People understand and embrace the simplicity of sorting and editing data values in a grid.
As we announced at SPC18, we are pleased to finally release our enhanced Quick Edit, bringing the power and simplicity of “spreadsheet” views to modern SharePoint lists and libraries.
You can preview the new Quick Edit in this self-service walk through. Let’s look in more detail.
Filters Pane is now available in Quick Edit Mode
Users can filter their content in Quick Edit mode to locate the items for updates. In addition, any filters or sorting applied in Quick Edit will persist as the user navigates back to the normal view.
Filtering in Quick Edit
All formatting appears in Quick Edit
Any custom formatting for the list or document library will now also render in Quick Edit. For example, this includes experiences like row formatting, user profile photos, conditional formatting, and data bars.
 Formatting in Quick Edit
Breadcrumb
Just as in normal list and document library views, the breadcrumb will now appear in Quick Edit. This gives you a visual clue about applied filters and a simple way to navigate “back” to larger data sets.
 Quick Edit breadcrumbs
Adjust and save column widths
Users can now define their preferred column widths by dragging and dropping directly within Quick Edit. In addition, any previously save column widths (either in the view or in local storage) will persist for users when they navigate to Quick Edit.
Drag and drop columns
Easily re-order your columns within Quick Edit by dragging and dropping.
 Drag and drop columns
Enhanced people picker
You can now browse and selected users from your organization directory efficiently with our new people picker. You can browse for partial name matches and see user photos and titles in line, as shown below.
 Enhanced people picker
Quick Edit enhancements will start rolling out to Targeted Release in July 2019. We’ll continue to share the latest news here on the TechCommunity. Thanks.
Delivering data insight and intelligence is essential to reinventing your business processes. SharePoint provides a great system to aggregate data and documents, and to integrate Power BI based reports and dashboards across SharePoint employee experiences and Microsoft Teams. That’s why we’re pleased to share these three new white papers to help you learn how to deliver better Power BI reports throughout Microsoft 365 on the Microsoft TechCommunity Resource Center.
Using SharePoint and Teams as a Modern Dashboarding Platform
SharePoint has a long history of providing a first-class platform for business intelligence dashboards based on Power BI, Excel Online, Power BI Report server, and related tools. Adding conversations and other collaborative content brings context to the content and helps to foster a data culture. SharePoint pages, as well as lists, can be integrated into Microsoft Teams, bringing all this richness to the Teams collaborative environment. This paper will outline the various approaches to building dashboards in SharePoint, Microsoft Teams and SharePoint Server.
https://aka.ms/sharepoint/dashboard-wp
Using SharePoint as a data source for Modern Reporting
SharePoint is a great organizational data store. SharePoint lists offer a quick and easy way for users to store and share millions of items, while document libraries have become the industry standard for document management, supplying secure, reliable storage. There are several technologies for working with SharePoint data, such as Power Query, Excel, Power BI, SQL Server Reporting Services and SQL Server Integration Services. This white paper examines the different platforms and approaches that can be used to report on SharePoint data and explains the procedures.
https://aka.ms/sharepoint/reporting-wp
Using Power BI with Complex SharePoint Field Types
SharePoint lists supply a quick and easy way for users to store and share millions of list-based items. Text and number fields are straightforward, but complex field types in SharePoint present several challenges. Power BI provides tools to aid with these challenges, and these tools are the focus of this white paper.
https://aka.ms/sharepoint/datatypes-wp
NEW! Check out our latest white papers to help you learn how to use Microsoft 365 and SharePoint to transform your organizational data, analytics and reporting.
Using SharePoint and Teams as a Modern Dashboarding Platform (https://aka.ms/sharepoint/dashboard-wp )
SharePoint has a long history of providing a first-class platform for business intelligence dashboards based on Power BI, Excel Online, Power BI Report server, and related tools. Adding conversations and other collaborative content brings context to the content and helps to foster a data culture. SharePoint pages, as well as lists, can be integrated into Microsoft Teams, bringing all this richness to the Teams collaborative environment. This paper will outline the various approaches to building dashboards in SharePoint, Microsoft Teams and SharePoint Server.
Using SharePoint as a data source for Modern Reporting (https://aka.ms/sharepoint/reporting-wp)
SharePoint is a great organizational data store. SharePoint lists offer a quick and easy way for users to store and share millions of items, while document libraries have become the industry standard for document management, supplying secure, reliable storage. SharePoint libraries supply the backbone for document storage in all of Office 365. There are several different platforms and technologies for working with SharePoint data, such as Power Query, Excel, Power BI, SQL Server Reporting Services and SQL Server Integration Services. This white paper examines the different platforms and approaches that can be used to report on SharePoint data and explains the procedures.
Using Power BI with Complex SharePoint Field Types (https://aka.ms/sharepoint/datatypes-wp)
SharePoint lists supply a quick and easy way for users to store and share millions of list-based items. Text and number fields are straightforward, but complex field types in SharePoint present several challenges. Power BI provides tools to aid with these challenges, and these tools are the focus of this white paper.


