Step 3 – Work the Business Requirement
Now you will need to factor the actual business requirement and then determine whether features of SharePoint 2013 can be applied, whether a third party product can be applied, or other alternatives. This part is not wholly technical, it is understanding that attention must be paid to ensuring that the requirement can be met, and that once it is met, that the same process can be applied (i.e. repeated) for any other request without having to carry out a significant amount of rework.
First you will require a design statement. A design statement is a number of lines which states who requires the analytics, the focus that needs to be applied, the key requirements of the analytics, including any other key items of information concerning distribution, etc.
Note. Remember to use the Business Gathering article to help you formulate a design statement.
I have given an example of a design statement below concerning a Human Resources site in an organization called Fabrikam Manufacturing.
Scenario: Human Resources department in Fabrikam Manufacturing have a SharePoint site. On that site, they provide forms for holiday, sickness, leave, job applications. As a company rule, all sickness forms must be filled and then uploaded into a document library in the Human Resources site. Human Resources needs a monthly report showing all interaction with the procedure documents on the site, so they can measure and the usage of the documents. They need to see this in chart format along and the report needs to contain those who have accessed the procedure documents.
Let’s work the Human Resources requirement. First, we start by having Human Resources answer these questions.
- Are the users who need to view the report site owners?
- Are Human Resources expected to have input to the report?
- Do Human Resources team members have Excel skills?
- Does the report have to be generated on a particular date?
- Does the report have to include rolling statistics?
- Is it possible that Human Resources will require more charts covering other aspects of the site?
- Is it possible that Human Resources will require more information about the form usage?
- Does the report need to be presented as a dashboard on the Human Resources site?
Once these requirements are gathered, we need to be able to map those objectives and prioritise as necessary. This is done so we can then derive what the best solution is to meet the objectives. Again, this is not wholly a technical exercise – it is needed to choose what alternatives should be addressed to determine which is the most suitable in terms of cost, support, usability – in short, most of the factors noted in the questions just covered.
Identify Alternatives
Using value management techniques, you could identify whether SharePoint 2013 meets all the relevant questions (plus some others). Once done, you will be able to see things from a technical and business perspective, giving you an idea on how the solution would operate, using the identified alternatives (e.g. do nothing, adopt SharePoint built in feature, adopt Third Party, get a Developer).
You should visit this page which describes how to apply value management in determining what technology can be used to address business requirements.
Using value management techniques you can then create primary and secondary objectives which will inform you what features are required from the Web Analytics tool. This is further depicted in Figure 1.0 below.

Figure 1.0. Value Management to prioritise and add weighting to each key objective and sub-objectives.
Using the map defined from the question and answer session with the business as the example in Figure 1.0, a matrix showing a number of products, and a test to see if the above requirements can be met by those products. This is shown in Table 1.0 below. Try to see which one you should go for. If you chose Product A well done!
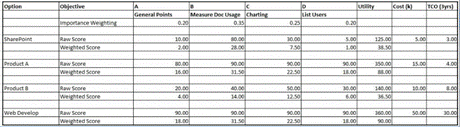
Table 1.0: Value Engineering to identify the best product to meet the requirements.
Note that for each of the alternatives in Table 1.0 it is not simply a case of writing down numbers and hoping for the best. A significant amount of work must take place to ensure that you appraise each of the products. For example, I am going to take a look at one of the alternatives from the table, SharePoint).
Use SharePoint built Web Analytics. From a technical perspective, you could get this data by using, for example, the events obtained from the audit log reports on the site. Specifically those which relate to opening, downloading documents, or other events like checking out etc. This information would have to be exported to Excel 2013, and then from there, could be forwarded to Human Resources, or be pushed back into the Human Resources site and then consumed using Excel services onto a specific page in the Human Resources site. In SharePoint 2013, in the document library where the form is located, the user could highlight the form, and from the ribbon click Popularity. Note that no information concerning list of users is available.
Use SharePoint built in feature. From a business perspective, Human Resources would have to be mindful that there is a human element involved, which is the creation of the chart in Microsoft Excel, the manual provision of the document to a SharePoint site. Of course, this means that the resource would have to be provided to do this work. If they did not create the chart based on the report, then someone would have to get the report to expose the relevant chart. It is also possible therefore, that there will be times when the report could not be produced on time, or is subject to human error in the creation of the chart. Additionally, there is a support overhead, and a skills overhead to consider.
The only real advantage of the SharePoint built in feature from Table 1.0 in the value management exercise is ‘Can be provisioned using built in features’. The disadvantages (which is possibly why Web Analytics is ‘glossed over’) are that people are required, specific skill sets are required, management of the report is required, and the output will need to be ‘tweaked’ to show the data required. In short, it’s all about the actual processes required to get the report to give meaningful data – and that requires resources. Some companies faced with this, even employ analytics personnel to come in, harvest the data and then present back to them the information needed in the form of charts using a mass of business intelligence. And because of all of this, the cost to provision is not cheap. The time taken for the report to be created by possibly more than one person, and the cost of even bringing in consultants may outweigh the value of providing the report. And the key disadvantage is that the requirement is not fulfilled since Human Resources need the list of users who have accessed the procedural document. That is not available unless a separate output is done using the audit reports, and again, that needs to be cleaned up in Excel.
The two links below will provide you with detailed instructions on how to apply Value Management techniques which will help you model out a method of choosing from a list of alternatives.